5 bullish indicators for Bitcoin: A new ATH soon in 2022?
Bitcoin price has been trending higher over the last couple of weeks, going from 38K to 48K. This article goes over 5 bullish indicators for Bitcoin showcasing why this trend will continue driving the bitcoin price higher to the $60,000 range.
Once we get back to the all-time high range where we, each time, witnessed a major resistance last year, the question remains: Could we see a breakthrough toward the $60,000 range, a move that will kick off the third wave of this bull market?
#1. MACD indicator
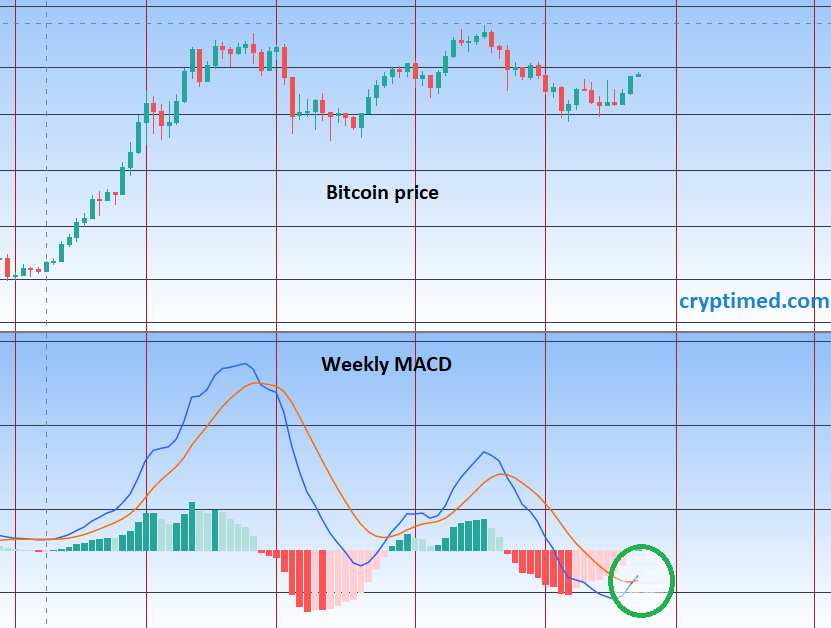
The MACD is made of two moving averages represented on our chart by the blue and the red lines; these two moving averages have different periods; the difference between them is represented by the individual red and blue lines (histogram).
What the MACD helps you identify?
The Moving Average Convergence Divergence helps us identify points in the price chart where the trend might be accelerating.
When the blue and the red lines cross (as indicated on our chart with a circle), many smart investors/traders look at potential entries.
In this case, we can clearly see a bullish cross. Such a cross might indicate a solid price reversal during the coming weeks.
#2 The SMAs 10, 50, 100, 200

Another indication that Bitcoin is about to mark new highs is the association of the 4 Simple Moving Averages. It is one of the strongest indicators that an investor can use to identify if the trend is going toward the highs or falling to the lows.
On this chart, we can observe a drastic change in the trend, with the Bitcoin price going above these 4 simple moving averages indicating an important reversal and showing a possible strong movement during the next weeks.
#3 Bitcoin: Percent of Supply Last Active 1+ Years Ago
For those unfamiliar with this metric provider, Glassnode is currently the world’s most comprehensive and most known crypto-related metrics and tools provider. This website helps digital assets stakeholders better understand a certain asset while having an overview of the latest market intelligence and analyses.
The importance of this blockchain data and intelligence provider is still growing as the interest given by investors to digital assets on-chain and derivatives data mark new highs.
Going back to our third most important indicator – and just as it shows, we can observe that the percentage of supply that had not moved in over a year is standing at its last all-time high, a level reached only once back in September 2020. We all know what happened after September 2020!
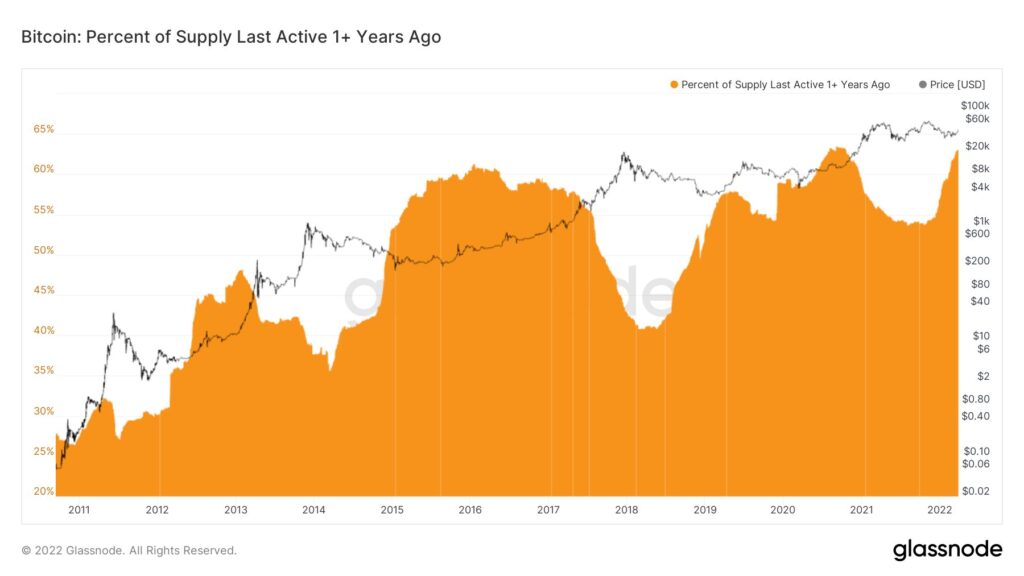
Furthermore, considering the correlation between the +1 year inactive supply and the Bitcoin price, we can expect Bitcoin to go toward new ATHs this year.
Many experts believe that the Bitcoin inactive supply will continue to increase and reach yet another level around 70%.
#4 Bitcoin: Short Term Holder NUPL
Here comes another Glassnode on-chain indicator and probably the most important out of the 5 bullish indicators for Bitcoin. This indicator shows clearly that the market sentiment is switching sides to move toward the optimistic area.
In case you’ve never heard about the NUPL or the Net Unrealized Profit/Loss indicator, here is a quick definition:
The NUPL looks at the difference between Unrealized Profit and Unrealized Loss to determine whether the market, in general, is currently in a state of profit or loss.
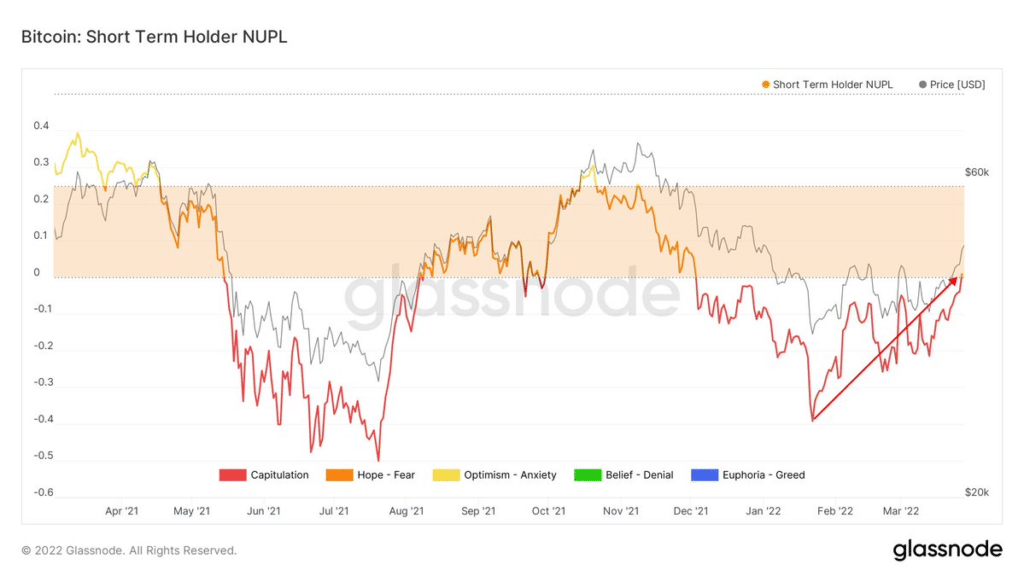
The last price action puts an end to the short-term holders capitulation as Bitcoin closed above the $46K weekly level. The current unrealized profit sheds a light of hope as the market is aiming for higher price levels.
#5 Bitcoin: 4H/8H/Daily/Weekly Strong Reversal
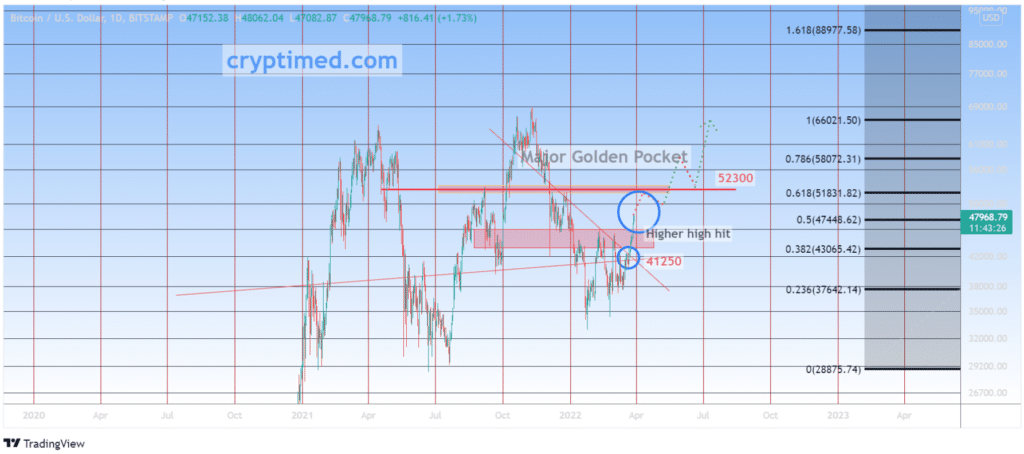
This chart’s technical analysis shows 4 strong bullish indicators, both on the 4 hours, 8 hours, daily, and the weekly time-frame. With the most important being the daily move above long-term resistance. Bitcoin can still consolidate between the weekly Fib retracement levels of 0.5 and 0.618. This leaves doors wide open for another strong upward move toward the most important resistance yet to come, which is located in the middle of the weekly fib golden pocket at around $52300.
Many traders will certainly take profits at the major golden pocket, making this level an important resistance. Nevertheless, given the other 4 bullish indicators, we believe that once the selling pressure is exhausted, the Bitcoin price will climb higher as many traders and investors are still in disbelief.
In conclusion, these 5 bullish indicators for Bitcoin indicate that the market is still confident, excited, and expecting higher prices. Plus, the crypto market is slowly getting past the fears related to macro concerns such as the war in Ukraine and the FED’s rate hikes.